Showing posts with label Chart. Show all posts

Tuesday, June 19, 2018

Ending-diagonal count: lower, then higher, then done

I'm counting the current mess as an ending-diagonal, which I think still has some room to go lower here over the next two days.  Has China responded to the latest tariff move?  When do we uncover the next corpse in their shadow banking system?  Who's the next corporate bond default?


We have a rising 50 DMA, which is also right around the 2715 level, where we would see a W1-W4 overlap on the ending-diagonal.  It would then bounce sharply, rallying to around 2820, closing a gap into the July 4 break.  I pray that we still celebrate Independence Day.

The problem with the New Moon 2791 high recently is that RSI made a similar extreme, suggesting that this move was the W3 in the series.
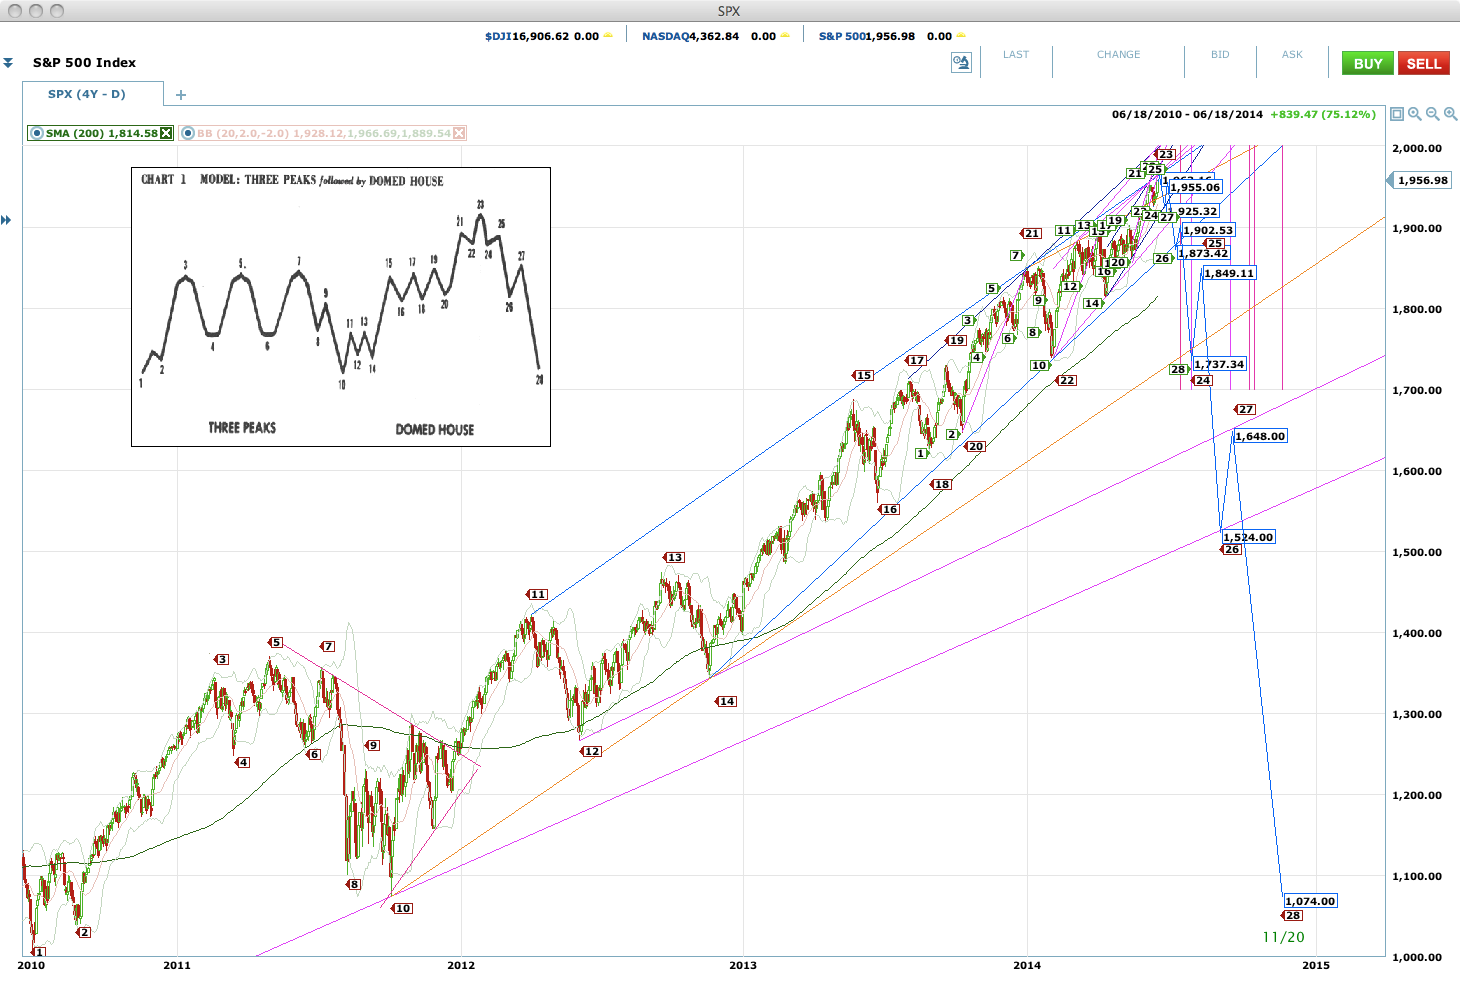

SPX daily 06-19

McHugh has quietly noticed we are in a new window for a Hindenburg Omen and subsequent crash.   Sssh!  Don't tell anyone.

Friday, March 13, 2015

The Panic of 2015

April - June, gentlemen. 

Or maybe I'm just trying to stay ahead of Bicycle in the bearish arms race.  He is formidable!

SPX 1Y "Panic of 2015" crash