With a low tide in the morning, I can do the long walk that takes me from Golden Gardens park in north Seattle all the way up to Carkeek Park further north. The entire loop back home is maybe 4 or 5 miles, a very nice walk.
 |
| Mt. Constance (Olympic Range) over Puget Sound |
So we're just waiting for that last tag of the top. It looks like 5/19 or 5/20 ought to do it.
From there, 1650 and even 1560 are targets for a sharp break south.
 |
| SPX 05-13 |
Work continues on one last batch of skinny townhouses around the corner from me, on the site of the old Crown Hill Lutheran Church.
 |
| Chip-board townhouses! |
 |
| Better buy one now ... |
 |
| so you aren't |
 |
| priced out forever! |
Reviewing the 2008 crash tape again, I noticed something very strange. I took Manfred Zimmel's 2014 Bradley model cycle turn dates and applied them to the 2008 chart -- see the orange lines.
 |
| 2008 crash tape with 2014 Bradley cycle turn overlay |
Now Bradleys are dodgy astro-market stuff and may not be your cup of tea, that's fine. However, they have been spot-on with the current tape for a while now, nailing some very important turns.
And for some odd reason, the 2014 Bradleys absolutely nail some key turns from 2008. We have to be careful not to conclude too much from this, but for now I want to suggest that the order of the downlegs in the upcoming cycle may be reversed.
In 2007, we topped in the fall, and put in a 5-wave stair-step "A" down. "B" corrected this, and we topped again on Monday, May 19, right after opex. By the way, there is another Monday, May 19, coming up next week, right after opex. The truly vicious, destructive cycle began off this May high at 1440 SPX. The seasonality is such that we are lined up again for another fall crash.
This is how I am suggesting the ABC down to the lower edge of the Jaws of Death megaphone would look, with the crash coming first this time around:
 |
| Jaws of Death completion to SPX 560 |
From a 1920 high, the "E" wave of the megaphone would be about 1.5x the magnitude of the 2007-2009 cycle, which was 910 pts on the SPX.
Of course, any good walk in the north end of Seattle requires a stop at Caffe Fiore on 85th Street.
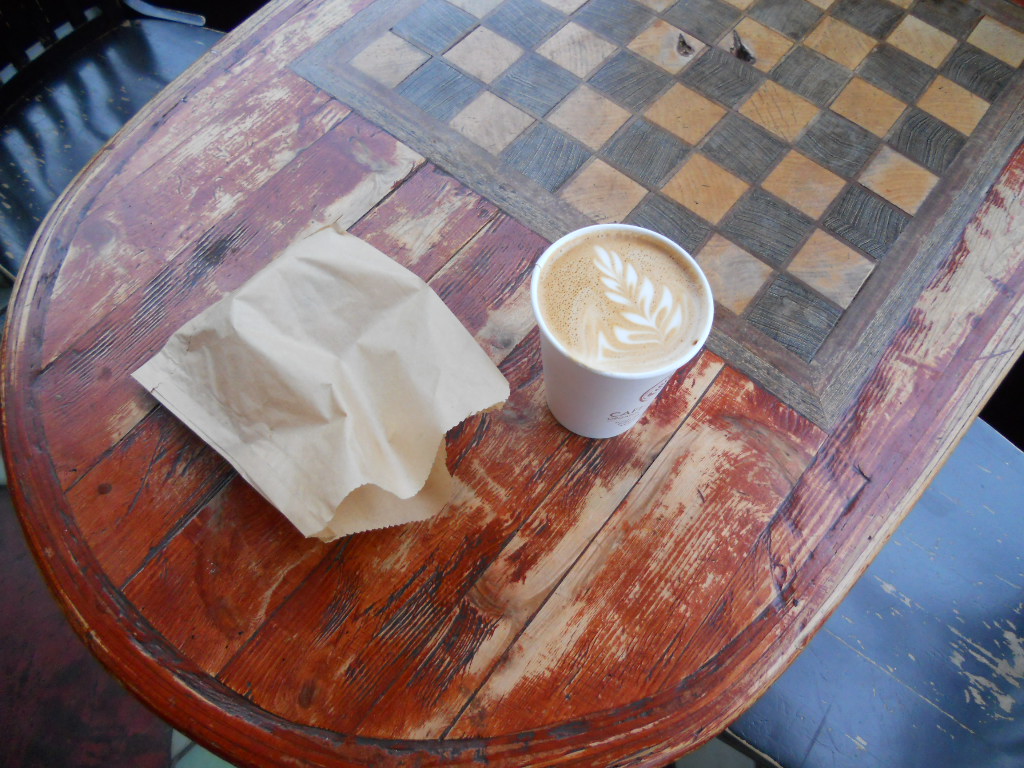 |
| Caffe Fiore |
3 comments:
I like your style of alternating paragraphs between the real world, and the financial world. We must never lose sight of Main St.
By the way, the "angle" of your crash scenario appears to be the steepest of any, even if its magnitude is slightly less than the 1929 crash.
Chart'1 is 'reasonable', but then, what is the catalyst?
Sheer market exhaustion, lack of QE..or a geo-political upset?
Personally, I think all 3 are already valid issues, not that the market currently seems to care.
-
A turn around 19/20 of May...@ 1920 or so...very possible, but...I'm increasingly inclined to think this drags out until the next FOMC of June'18.
--
As for chipboard houses, urghh..awful. I can't believe anyone would have the audacity to even suggest building a home like that in the 21st century.
I'm with PDoomster, FOMC week in June, and I think in the 1926-30 range.
Post a Comment