
If we draw some channels and add some fibs, we can propose our first low on all of this is the March FOMC, which also lands on a Full Moon.
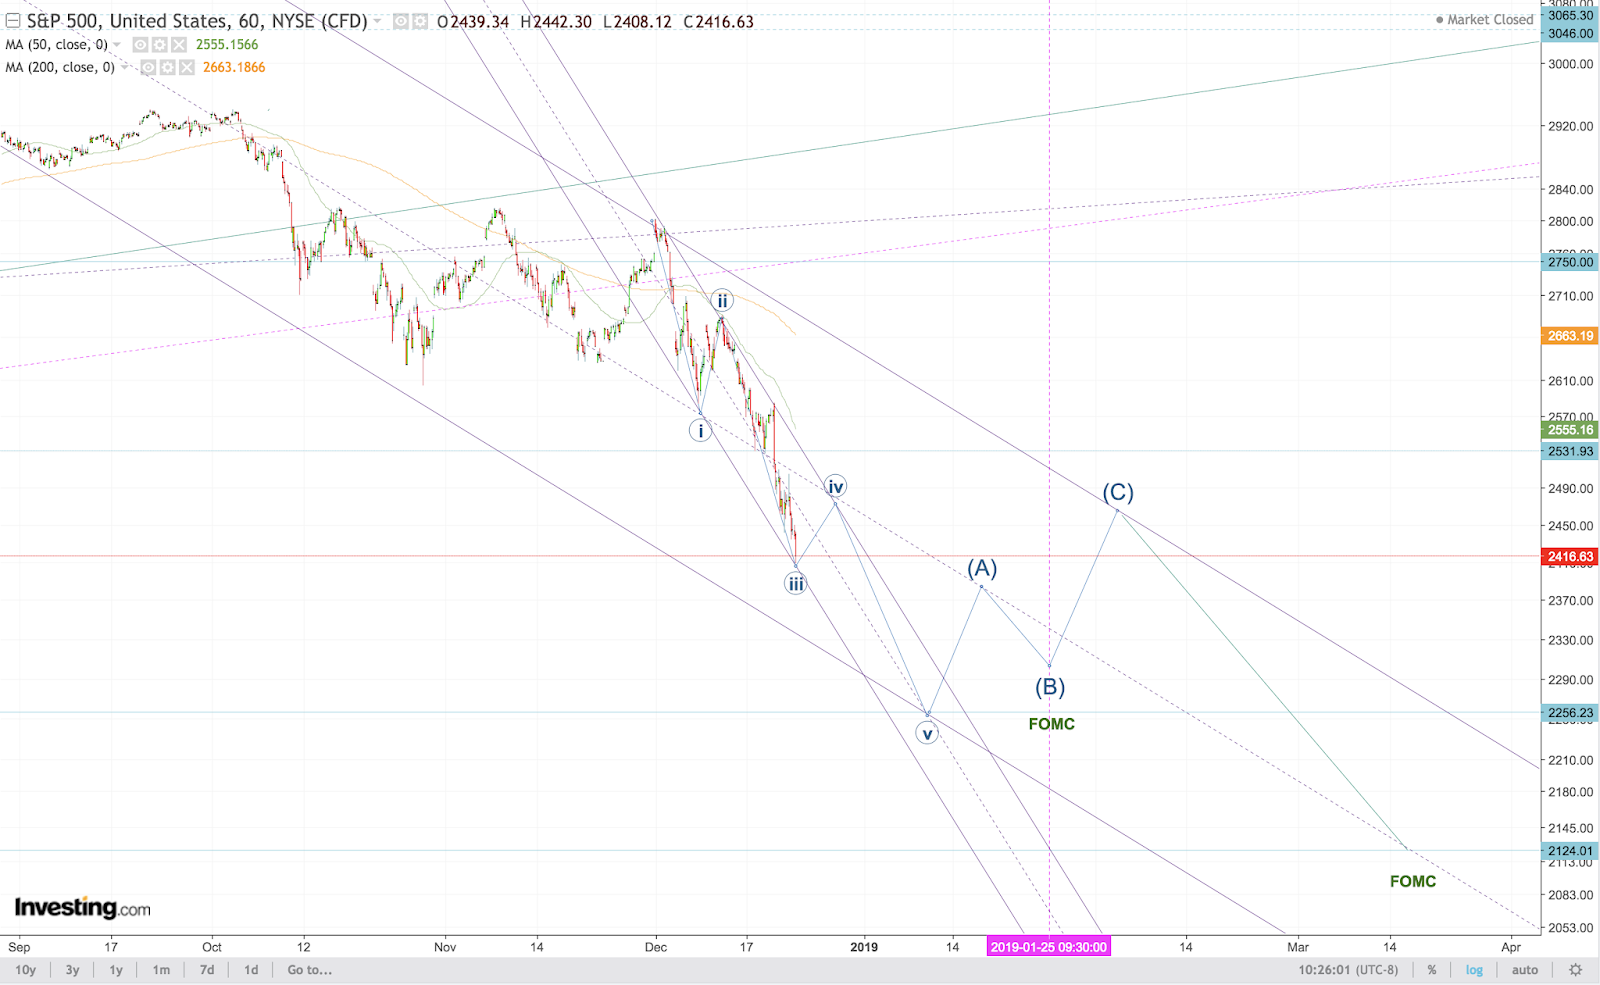 |
| SPX proposed low March FOMC @ 2124 SPX |
Larger question is whether the real crash phase that comes in Fall 2019 can break us out of a very long term, important channel. Losing this channel probably means the end of the long-term economic cycle defined by the existence and effectiveness of the Federal Reserve itself.
I'll let you draw your own conclusions from that proposal.
 |
| SPX weekly |
71 comments:
Possible, too, that this stretches out and goes even a little deeper (another 50 handles). 2071 is the .382 retrace of the entire rally up from 666.
The 50% retrace of that would be 2505 --where we had a violent rejection and reversal early Friday.
I think that iii of 3 is complete. If we look at the sub-waves from the 2685 high down to 2408, the first leg down has a length of roughly phi * the last one on Friday.
But. Problem here. We still won't have an "extended" leg in the larger move off the 2800 turn.
So there is the very real possibility that v of 3 extends, that we get a truly violent waterfall down even below 2100!
Like 2083 (2016 Election low).
i.e. the danger here is that we retrace a little this week, then bust out of the wave 3 channel -- in a violent v of 3 -- to greet the New Year.
If v of 3 down explodes and extends, then the target for the first leg down -- still completing March FOMC -- is ~2020.
2250/40s would make a lot of sense, and I like the ABC bounce wave you have, which would indeed be a powerful bounce.
Any such multi-week/month bounce should hold under the key monthly 10MA, and offer the 1500s within 9-15mths.
-
yours... reading around
"Any such multi-week/month bounce should hold under the key monthly 10MA, and offer the 1500s within 9-15mths." Let the uber bearish predictions begin! Not sure where we'll be in 9-15 months, but I highly doubt we're going to see 1500 ever.
Perhaps CG remembers that I did say in 2014, we'd never see <1500 ever again. I still hold to that. If we do get low, I'd imagine the Fed will have initiated QE4, and off we go again.
Blogger Hugh Jazole said...
Not sure where we'll be in 9-15 months.
December 23, 2018 at 4:18 AM
Blogger Hugh Jazole said...
Headed to new highs That's my current forecast. bullish for the rest of 2019 and on to new highs.
December 20, 2018 at 6:51 AM
The Fed will do a 180 long before we get to 1500. I call BS on their "normalization" program.
http://www.usdebtclock.org
That is my current forecast T. Berry, but the key words are "not sure." I'm leaning in that direction at this time, and it would require a policy change from the Fed, which I fully expect.
re: The Fed will do a 180 long before we get to 1500. I call BS on their "normalization" program.
-
A rate cut would be the ultimate sell signal. I'd expect the market to initially rally on it, but really, did everyone already forget the past two cycles? The fed cutting rates IS the ultimate sell signal.
Can't the Fed buy futures through primary dealers? I'm a bit of a noob about what the Fed can/can't do.
The thing I find interesting so far, is that there really hasn't been any panic selling. The TRIN has been pretty subdued through the downturn. The average person doesn't seem too worried yet.
If cutting rates is the ultimate sell signal, what was the sell signal for the recent selloff?
re: If cutting rates is the ultimate sell signal, what was the sell signal for the recent selloff?
-
The US 10yr yield, l/t trend from summer 2016, broken by the Powell speech in late November. That was preceded by Powell chatter Oct'3rd 'we are a long way from neutral'
-
Other world markets are leading the way lower, not least Germany, which is leading the EU into recession.
I assume there will be a bounce
(see the chart - a picture is worth a thousand words or something like that)
2409 - 2575 / 83 / 92 (upto 183 points) - a
2592 - 2482 (upto 110 points) - b
2482 - 2652 (170 points) - c / 4 / B
Then back to bear mauling and ms mkt serving humble pie.
2652 - 2318 ( 334 points) - C / 3
https://imageshack.com/a/img922/5342/dBDTAS.png
Oh and happy holidays CG. Btw how do you embed images?
Classic TA says we have to at least go back to SP 1500/1600, to retest the 2000 and 2007 breakout line. Such a retest would be bullish, if held, though the retest of the lower 2003-2009 channel near SP 500 is also very possible. But we're getting way ahead of us, and where ever we go, we get their one trade at a time. I believe the pattern Christian has shows for the fist wave down is correct, and I agree the big danger to that forecast is we crash much further and faster than he drew, as mom and pop panic, and some busted Lehman reveals itself.
PPT to the rescue.
https://www.investing.com/news/economy-news/us-treasury-secretary-convenes-calls-with-top-us-bankers-1729758
Think 4chan greentext mode here.
> PPT convenes
> market rises in iv of 3 wave
> crosses channel to 2474, .236 retrace
> breaks channel southbound, dives in extended v of 3 to 2083 (Trump election level)
Hi CG,
What if the fed starts QE4? Can they reverse course that quickly to avoid a crash?
If they do QE4 then it's really QE4ever, and we will go the way of Japan, with a central bank managed market (and economy).
Japan peak at 40,000 in 1989, then crashed, and three decades later their market trades near the 20,000 level, so not sure the US following their central bank lead means anything.
BPSPX at the lowest levels I've seen since I started tracking it. This might not be a garden variety bear market. CG, what do you think the odds are the powers behind the scene, want a massive stock crash on Trumps watch? Could they be helping things along?
The last time we were at these levels on BPSPX was 08/09. Just sayin.
Hi Kevin,
I think it means that the only way the market goes any further up is with QE. The market starts following to some extent the central bank's balance sheet.
I wish I could find a recent chart showing central bank assets vs stocks, but basically there's been a correlation between the two, especially for Japan and the US.
Right after the Fed started reducing its balance sheet the market started hitting all this turbulence. It's been about one year since they started and right now we're down for the year.
Now if there's causation here (not just correlation) then we really want to watch the balance sheet to see what the market does next.
If Powell continues reducing then the market goes down. If he pauses it goes sideways. If he restarts QE it goes up. PPT can stop crashes but they can't stop trends.
Is it a bear market yet? LMAO!
umdengineer, Lance Roberts realinvestment showed the chart in his free newsletter a couple of weeks ago. The problem is what I call the JP Morgan trap. Back in 1907 panic - before the FED was created - the stock market dropped 50%, and there was a run on the banks. A lack of liquidity was deemed the culprit, and JP Morgan is credited with solving the crises by pony in up his money, and convinced other big bankers to do the same. The good times returned, only the next time there was a financial crises the JP Morgan put failed to work as stocks and banks crashed in 1929. Charts with liquidity are nice, though confidence is at the heart, not the actual money. For instance, there is no such correlation with the BOJ balance sheet and their stock market. While you maybe correct that more QE is the answer and will save the markets, I believe that such action likely fail next time around. Or lead to an even larger Elliott Wave 5 blow off that ends even worse. The markets are bigger than the FED. Of course the markets will bounce when they announce more QE - as I don't expect them to do it till after the horse has bolted crash - with the markets likely in position to bounce at the time they pull the trigger.
Those so called puts - JP Morgan, Greenspan, Yellen, Powell - are the "it's different this time" sure thing that pushes big money investors into making stupid and risky bets. It is the failure of those bets that creates collapses and financial crises. Bubbles, once created - thanks to the FED - always end in disaster, and this one will too. Of course there's the question of timing, though this sure looks and smells like it to me!
Yes, Hugh, we are in iii of 3 in the first waves of a Bear Market.
I just finished Murray Rothbard's excellent book, America's Great Depression, where he lists in great detail the credit expansion taking place in the financial sector all throughout the 1920s. And then when we finally ended the inflation, we just couldn't let wages and prices return to normal, we kept tinkering and meddling, so we got the Great Depression.
Rothbard does a fine job detailing the meddling in the economy that came long before the New Deal. Every POTUS wants lower interest rates and easy money, it seems.
Hugh, $BPSPX spikes to these crazy levels in both the beginning and bear markets, and the end of bear markets. Which one is this one?
"Hugh, $BPSPX spikes to these crazy levels in both the beginning and bear markets, and the end of bear markets. Which one is this one?" I'm not sure how many times these levels have been reached historically. We started the day at 16.40 and ended at 11.80, I've never seen anything like it ever! Since the market had a half day, it's almost a certainty it hasn't hit bottom. We did get a little pop in the TRIN later in the session. Oil is a major issue, is the Gail Tverberg nightmare scenario coming true?
Kevin, thanks for that reference. It has the chart I was looking for.
https://realinvestmentadvice.com/wp-content/uploads/2018/11/Fed-Balance-Sheet-SP500-110518.png
Hugh, go to stockcharts.com and pull up a weekly chart of $bpspx. Then in the "range" box, click set start and end date, and adjust start date to 1995. That will pull up a chart of $bpspx all the way back to then. If you adjust the end date, you can see how $bpspx compares to $spx around spike times. Seems to me $bpspx spikes low, then rises, then stocks hit new lows while $bpspx does not to indicate that sell wave for stocks is over. Watching for that here.
It's a clumsy indicator for sure. I guess it's just a bit concerning that it continues to tank, along with the market despite +div, and oversold conditions. I'm starting to think there is something lurking behind the scenes, that none of us are seeing.
Hi guys. I hope that all of you have been hedged or been able to make money during this current market downturn. I'm surprised that no one has brought up the fact that the European banking system is in a lot of trouble. If you start looking at some of the major banks in the eurozone it looks to me some of them are in really under stress. It would explain some of the behind scenes action in DC and in Europe. As it would also help explain a lot of the current market action. Happy Holidays guys and hopefully a prosperous new year (whether the market goes up or down).
Great thread about historical levels of BP indicators. Sheeeeit!
https://twitter.com/RickyRoma0/status/1077297117532631041
What are the odds that we are at point 20 in 3pdh?
https://finviz.com/futures_charts.ashx?p=d1&t=DY
Can argue for 26 on dax though but es and eurostoxx dont look like they have seen > 20 yet.
CG please post your 3pdh counts if possible. Btw I had 2318 back in nov (around 8th 10th timeframe) when es was at 2800+. Today it bounced off of 2317. See below:
before
https://imageshack.com/a/img924/9075/UKpaj8.png
after
https://imageshack.com/a/img924/1576/51yZFl.png
Who knows if is 3PDH at all, the time is all off compared to the classic pattern. To my knowledge the best really good 3PDH was in TLT a decade ago.
I'm wondering ATM if we might pretty hard in the morning off the 2332 level SPX in a sharp (iv) of 3. We have a long way to go up to get a clear look at the corner defined by (ii) of 3.
I'm also wondering if (v) of 3 might just complete Monday morning in a spectacular one day panic to finish of 3 down.
We need a big 4-5% down day to complete wave 3, though risk remains that 5% turns into the big one down 15%. Nenner says rally into Jan 17 before dive resumes, though needs to close above SP 2410 to begin that. Armstrong has this week as a panic week, which can be a big move down, or a volatile up and down week.
now well that bear didn't last long. shortest bear in history lol
the last time a president said buy the market was back on march 5, 2009 and the start of what became the longest bull market in history. that was possibly the best stock market call of all time. thank you president obama!
let's see how the don's buy works out. his call could be the one that ended the 1-day dec 2018 bear mkt. : )
the 2018 big bad bear lasted less than 4 trading hours. lol
The bear will quickly strike again. The sooner these markets deteriorate and take investors' wealth away, the sooner I get my pay day, and that is all I care about. Don't worry, we'll get our patriotic "bull market" again when QE4 is announced and the dollar is destroyed.
unknown,
you might have to wait another 8-9 years. average bull markets last 97 months.
just sayin'
Bear market rallies are wonders to behold, and short-lived, and offer great opportunities for traders to get positioned ahead of new lows, which are coming fast. Wave 3 not over yet...with much lower prices to come as Wave 3 ends, and wave 5 takes away all hope.
got to be frustrating to wait 7,8 even 9 years for the bear to show up and when it does it only lasts a day. i feel your frustrations.
let's hang a 1000 on the new bull!
Almost 1000 point gain today so far... could go for the record. PPT in action.
Hugh Jazole said...
Is it a bear market yet? LMAO!
yep, the s&p fell a whole .9 points into it.
hope you enjoyed all 4 hours of it hugh. ROFLMAO
rip 2018 bear lol
historic record stock market day! the dow/sp/naz have never see bigger point gains.
new bull same as the old bull : ) hung that g on the dow!
bear in the headlights lol
T.Berry said...
let's hang a 1000 on the new bull!
December 26, 2018 at 11:00 AM
chicken dinner. lol. you'll NEVER see the dow down 1000!!!!!
umdengineer, you ain't seen the worst of this new bull market. remember they last a long, very long time. : )
cheer up hugh, 2019 will be better for ya---
Hugh Jazole said...
bullish for the rest of 2019 and on to new highs.
December 20, 2018 at 6:51 AM
DOW BIGGEST point move up EVER - Kevin, I told ya PPT would not allow a Christmas crash! :)
Nenner is likely right - we should bounce at least into the New Year.
Armstrong is a clown - he has been Wrong on all his panic weeks for a long time!
2018 was fine for me, because I saw the downturn coming, ahead of schedule even. I would hate to be one of those people who made margin buys near the top. I do think 19 will be more bullish than the doomer crowd believes, but don't have confirmation yet.
I bought an index etf this morning T.Berry. I figured we were oversold, and Trump basically demanding PPT be unleashed.
I also bought something to hedge against a real estate crash just in case. :)
Hugh, I think it will all depend on the Fed. Trump's tax cut was a structural change that brought us a benefit, but now that's discounted and the Democrats have control of the House starting in January.
Normally divided government is good for the market, but the hypothesis here is that the US economy has matured (basically due to demographics) and is now more dependent on the Fed printing money than anything else.
Really want to see what the Fed's next move is, and how quickly they can move.
good on you umdengineer! this is just the start of a mega rally. wait till the asian mkts open tonight and europe tomorrow.
from the looks of ah action it isn't stopping anytime soon either. this new bull is gonna make a statement
umdengineer said...
I figured we were oversold
December 26, 2018 at 1:09 PM
yeah on very low volume too----there might have even been a tad bit of manipulation on that ride down too. just to claim "bear market" to spook the individual investor into selling. i'd say it didn't work as many individuals learned from 2009 that the stock market always comes back.
2346 never again!
Bearish count still has us in a wave 3 down, but there is very little room to maneuver. Would need a modest red day tomorrow and a close Friday at 2474 to finish (iv) of 3.
(v) of 3 makes new lows in the 2256 area.
If we head up and out over 2500, then the case that we are building a 5-wave impulse down off the 2940 high starts to fall apart, i.e. it's something else.
cg, i'd say it's going to fall apart and we're going north of 3,000 in 2019 (even hugh agrees we're going to new highs next year).
the economy is just too strong for the stock market to be this low. corps are still seeing record profits and the consumer is doing well. if they weren't we wouldn't have seen record holiday sales. especially with the stock meltdown right before x-mas.
Christian, your count is what I've got. Small wave 4 end soon and target a 5th wave to complete wave 3 hard below 2300. Then we churn baby churn right back up here in a larger 4th wave. Before a larger 5th wave takes out 2300 in a significant way. Then we get to rally back right to where we are now.
Alternate count is, wave 3 low is in already, then tomorrow is up big, and Friday even bigger - though ends bad. Then the high then on Friday is traded above for one day, to complete the 4th wave, before we head to new lows again/.
Either way, we are close to the next peak, and the lows have yet to be made.
Patience, grasshopper, patience
The grasshopper got trampled by the bulls today - and is in the ER awaiting surgery :)
SPX downside target prices...
wave 3: 2260-2250
wave 5: 2150-2135
Im watching the dollar for clues
"Im watching the dollar for clues"
what do you 'see'?
So I look at it as the dollar topping will give a boost to commods and eventually to multinationals, ie, the bounce if it has legs will be on the back of a weaker dollar. If it doesn't happen, then I think we just keep heading south
If this is just a bounce inside of the wave three, still bound for 2256 on the S&P in early January, when we would hit the channel wall right at EOY at about 2465. We could gap down from there, because it will get filled.
Both scenarios get us down to ~2150 into March FOMC, where the policy levers can be tweaked. It's just a matter of the waves and their relative proportions to getting us there.
btw, there still is a 15 pt GAP in the S&P chart up at 2650 -- anyone think it needs to be filled?
Post a Comment