Thank you Bryan for the title. The reversal off the 2484 SPX high looks decent so far.
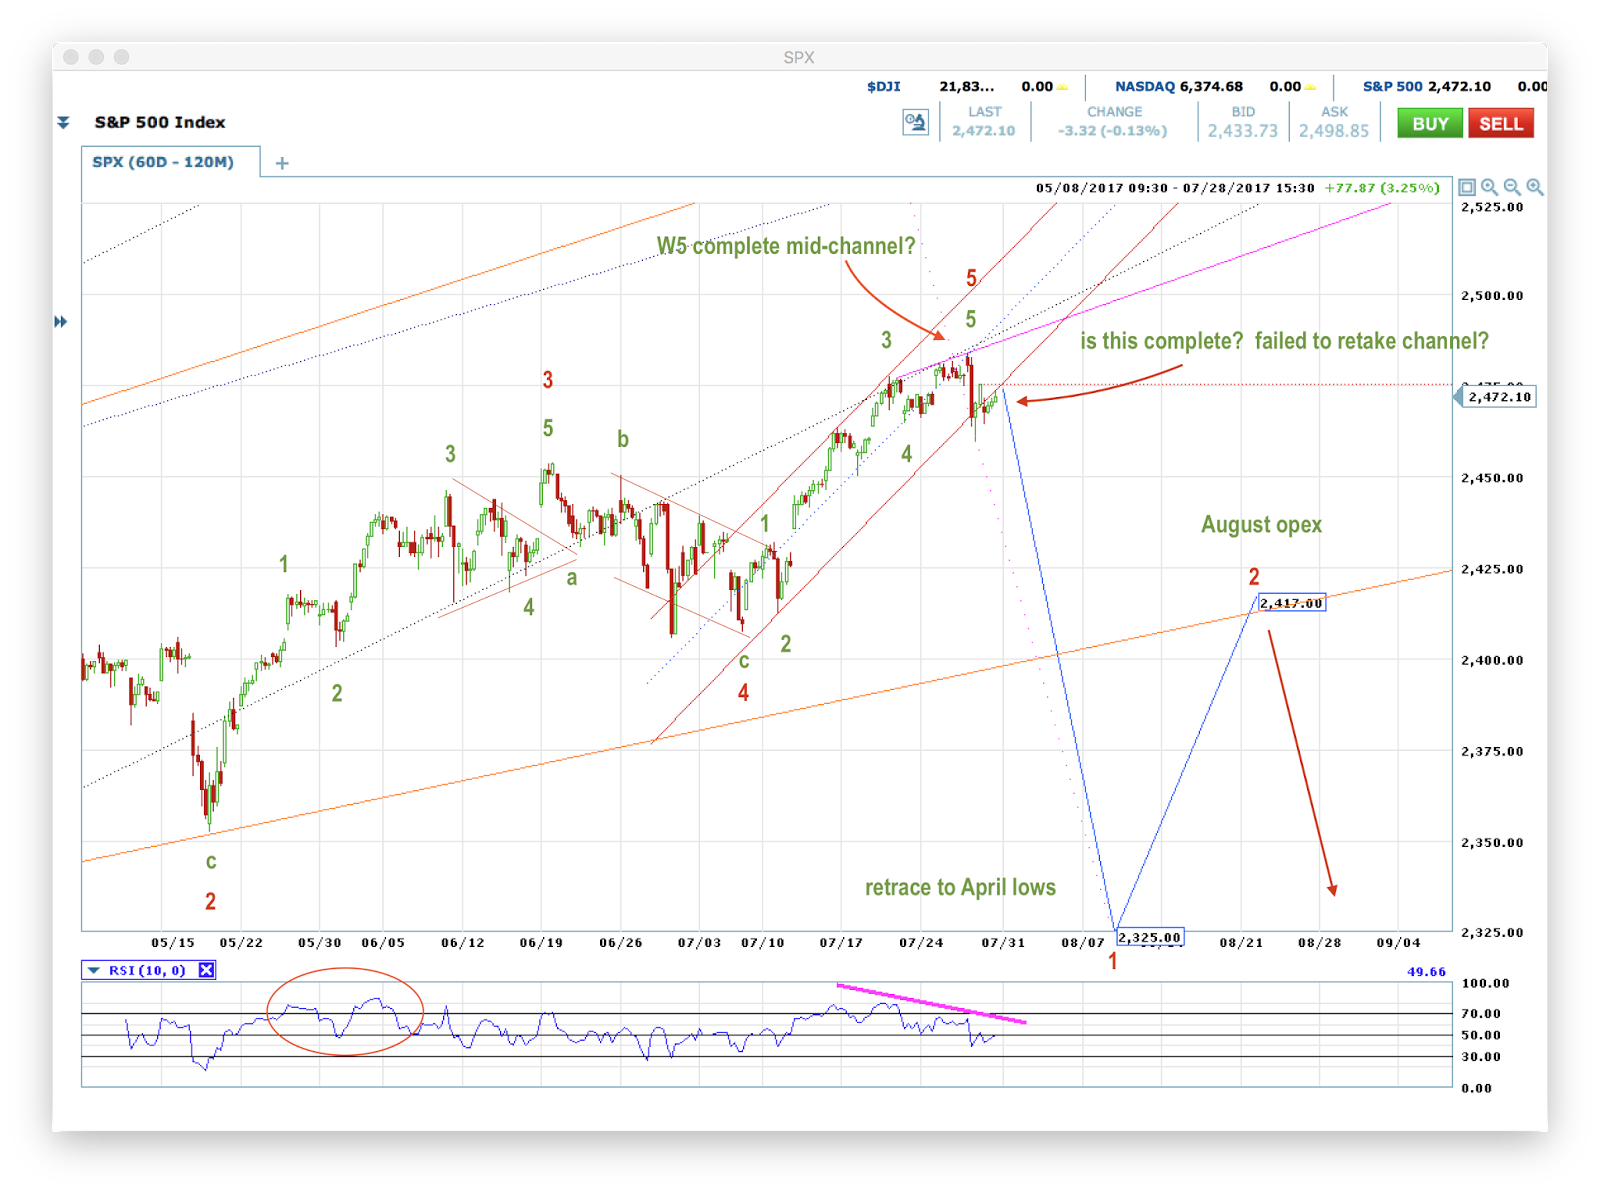
If we've topped, then the first order of business will be to retrace -- quickly -- the 5-wave move up from the April lows, followed by a bounce. If I have drawn the channel right, you can see how the close today tried but failed to regain it.
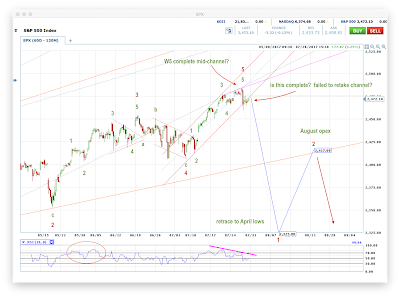 |
| SPX 60D |
If 2484 was a significant high, then it begs the question whether it completed a W3 or a "C" wave. There clearly is a 5-wave move up since the Brexit lows (1991 SPX) on the chart. The big question then is whether we can look down from these heights, or if we have another 4th wave correction and 5th wave rally left in the tank. IMO, all of the major legs since the 2009 (year) lows count as triplets, ABCs.
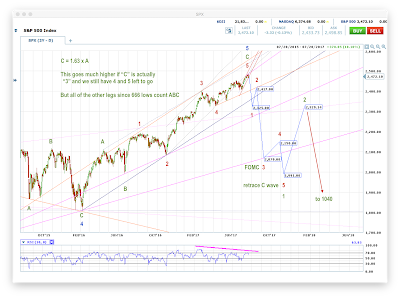
If 2484 SPX marked the end of C of 5, then we can revisit the Brexit lows this fall like so:
 |
| SPX 2Y |
If 2484 SPX marked the end of a W3, then the .382 retrace of the 1991-2484 leg is 2295 SPX; we will watch for this carefully, because a 5th wave similar to the initial bounce from the 1810 lows would bring us very close to a final high target of 2600. We have to keep this possibility in mind -- especially if we find ourselves near the 2295 SPX level (and a pink trendline in the chart below) into September opex.
If we are looking for 5 complete waves up from the 1810 lows, and especially if the Fed rolls over at the September FOMC, then E-W suggests that we could indeed approach the 2600 level in a 5th wave up, as shown here with the heavy blue line.
 |
| Bullish alt: Fed flake-out blow-off |


40 comments:
Where did you find that GIF? People who stand in the middle of roads deserve whatever happens to them. I'll give the poor dog a pass, the man apparently isn't much smarter than the dog.
4chan ... be careful
My work shows we are either in iii of 5 - targeting SP 2600 for all 5 waves - or about to start a C wave to end wave 4 (similar to your final chart, though since this is a C wave, expecting a much milder decline than how you have drawn it,) targeting 2400 for 4 low, followed by SP 2600 (NAZ 6800) for wave 5. Either way, we crash after, like 1998 or 1987. If the crash is the 1998 down 30% variety that rockets to new highs by year end, then we could see the indexes double next year, just like we saw in 1999. If its the down 50% 1987 variety, then trade for the bounce, though keep a wary eye out for a 1987 pattern to morph into 1929-1933 pattern. No matter what, sure to be a traders dream.
Are we going to get any warnings from the bond market prior to these calls? So far it looks pretty quiet. We did get an ever so slight temporary inversion of the 3 month & 6 month in the last couple of weeks. It has since righted itself.
The CBs are buying stocks and ETFs. Print money, buy stocks. The money never enters circulation. It never enters the banking system. It enters in as a shareholder of Apple, Google.etc. yes, the Swiss National Bank is a major shareholder of these companies. And though our Fed tells us they don't buy stocks (or worry about equities), surely they discussed with the SNB their massive buying program. What could cause this support to end?
That this support ends is the only obvious thing that would allow for a more than 10% correction. Is there a less obvious thing that would allow for a crash despite CBs buying stocks?
Pension funds gotta eat, too.
Bryan, what happens when currencies swing against such overseas buyers to create a crises? It's a lot easier to buy when everything is calm and the markets going up. Though history shows that its never different, and what goes up must come down. That doesn't mean we won't get an even larger bubble if central banks go crazy as the markets fall - indeed, we could see the indexes double next year if we survive the fall crash attempt - though the bigger the bubble, the harder we fall.
While I don't mind following stock trends - even during crazy bubbles - I'm not going to be in the camp where this time is different.
Hi from Italy,i consider your charts very interesting...which of the 3 charts regarding SP500 do you think has the major probability to realise?
Hello Pietro --
Well, Tom McClellan thinks that we still need a VIX divergence before we can head down.
The same could be said for market breadth and the NYSE A/D line.
I do like that we have 5 waves up in a channel since the April lows on the S&P 500.
The trannies have already rolled over.
Techs put in an engulfing bearish reversal candle.
The Russell is all jacked-up into a long-runnning tight wedge.
We're always looking forward to the bearish outcome, if and whenever it gets here. The CBs have either discovered a monetary perpetual motion machine, or we are facing economic collapse and a very deep depression. I favor the Austrian outlook.
Thank you very much for your analysis. I ask you a great favor,if you can,i'm very interesting if you could also make a forecast chart for the eurostoxx banks. I'm short from very long time before usa elections and i'm loosing a great opportunity to be long instead short. So if you make a chart for the eurostoxx banks you make me a great kindness and help me to have a illuminant view. Your analyses are very important and i consider you a very good analyst. thi is the link if you want...https://it.investing.com/indices/stoxx-banks-eur-price.
Bryan what would prompt the central banks to quit buying stocks as that I believe this is the only reason stock are levitating
That's a crazy monthly chart, mon frère, on the Euro financials.
The symmetric triangle is obvious enough -- if it's a continuation pattern then it looks like your financial system goes to zero.
You're struggling right at resistance to see what happens next -- what a ball-breaker!
I'd post a link to the chart, but investing.com's snapshot feature for this does not work.
2600 is a stop along the ride to 3000. possible 5-7% correction along the way. many tops will continue to be taken out along the way. soon 2700 then 2800 & 2900. :)
bull market of a lifetime, easiest to make $$ being long and long term investor. fed has too many tools to let a crash happen. they have proved it over the past 9 years yet the number of crash calls around the markets are probably at record levels.
T.Berry, just change the "possible 5% to 7% correction along the way," to "possible 50% to 70% correction along the way" and I'd agree with yer! Bear markets follows bull markets. Always does, and always will. The higher and longer the bull goes, the longer and deeper the bear corrective phase is.
kevin, have been hearing (since 2012! with 1500 being thee top) the mkts are going to crash and s&p will fall to 600 or even 200. lol. bear markets pull back 20% or so which is fine because it will flush out the excesses and ready us for the next move even much higher than where it began. bears typically last around 18 months or so. besides the fed along with having circuit breakers in place would never let the market fall 50% or 70%. those events are once in a lifetime (1929 & 2008/09) much like the bull market we're in now. we'll probably never see one as strong as this or as long. again, i have no worries and will not be spooked out like those who sold out in 08/09 only to miss the greatest period of wealth creation this country has ever seen. rather than sell on the pullback, it'll be a great buying opp for the next leg higher. i don't doubt the mkt will pullback some but in 10 years it'll be 2 or 3x higher than today.
good luck i wish you well.
T.Berry, all the lack of a day of reckoning since 2012 has done is push an overgrown tree reaching for the sky higher and higher, which makes the likelihood of a collapse all the more likely, and all the more destructive when it comes. That's how the markets work. The more people in, the harder she falls. While the more people out near bottoms, the higher she rises. Bear follows bull, just as bull follows bear. Tis the way the markets work. History of margin debt at these crazy levels shows what we face next, and the central banks couldn't stop the last collapses of margin debt, nor will they be able to stop the next day of reckoning. Yes, the markets could double next year. Yes, the markets could be down 30% to 50% this fall. Need a plan for both, IMHO.
Greenspan bond warning. That's a face only a mother pelican could love.
https://www.bloomberg.com/news/articles/2017-07-31/no-bubble-in-stocks-but-look-out-when-bonds-pop-greenspan-says
https://www.washingtonpost.com/news/speaking-of-science/wp/2015/03/18/this-ugly-baby-pelican-will-grow-up-to-be-still-sort-of-ugly-but-in-a-cool-hip-way/?utm_term=.b233e2ba30f4
The 2480ish area is definitely a brink wall. We may have to wait till fall to clear it.
*brick wall*
"Yes, the markets could double next year. Yes, the markets could be down 30% to 50% this fall"
kevin, i'd give the same odds for either of those scenarios happening, less than 1% :) but in
9-8 years the mkts should be at least double from todays prices,
glad to see the new top at 22k bicycle. :)
hugh, i remember when s&p 1500 was the brick wall :) so is 2480 the new 1500? lol j/t
oh ok sorry bicycle. there just has been so many tops called since 2012 got confused lol. i'm a bull market investor not a perma-bear. tend to look at the positives of the markets on a long term basis. never played the short side nor will i ever ---way too hard for me besides it's much easier making $$$ in the long side and safer too. as i've said before i'm in for at least the next 10 years so i'll ride out any pullbacks and just buy more. this strategy is no fail.
if the dow just see's historical average returns (8%-8.5%) over 10 years, we'll be looking at dow 50,000. who ever wrote dow 36k will need to release a sequel. lol. : )
btw, i'm in your camp on dow 40k :) 22k will be a distant memory in a few months. august is historically bad month so that long awaited pullback could be coming soon. get your shorts on lol
per cnbc, dow jones hits its 31st new record all time high in 2017. not sure it it's a record but its got to be close. strongest. bull. market. in. history. marches on. lol
bicycle, if 22k gets taken out will your next top call be 40k?
aapl blows away earnings, up over 5 buck in a/h's might be a good chance 22k does down tomorrow with #32 on tap. good luck all!
T.Berry, Martin Armstrong - a guru I follow due to his great track record - believes we are headed to Dow 23K, and if we can get that then we are indeed off to 40k. However, at that points he sees us collapsing worse than 1930s. Hussman research shows that with valuations at current levels returns for the next decade is expected to be zero to losses (each year, on average, for a decade.) While I love your optimism, there's nothing out there to suggest we are in some kind secular bull market where we go further higher and those gains for held for any serious time frame. More like, we are in a blow off that will result in a complete retracement of the gains.
kevin, if he believes dow 23 it's going to 40k then. not sure what his timeframe is for 40k but i'm good waiting about 8 years (just over 8%/yr).
i just don't see any reason why you would sell this market here???? the earnings have been beating for the last few years and earnings are what drives stock prices right? aapl is a great indicator of the consumer which represents 70% of the economy. you don't sell $1,000 phones in a slow economy. americans have never been wealthier. everyone i talk with regarding the market say their 401k or stock portfolio has never been higher. that along with home prices at all time highs, strong corporate profits makes the market valued correctly.
if the next 5 months are half as good as the first 7 (which from recent earnings appears will be an easy beat), 23000 will get taken out pretty easy.
the dow jones is only 4.5% from 23,000. less than 1% gain/mo shouldn't be much of a problem.
"the earnings have been beating for the last few years and earnings are what drives stock prices right?" The late nineties saw stocks soaring even with lousy earnings. The 87 crash happened while earnings were pretty stellar. In 2007 the market had record earnings, and crashed one year later. Here is a list of companies by revenue. Notice Amazon WAY down the list.
https://en.wikipedia.org/wiki/List_of_largest_companies_by_revenue
"and earnings are what drives stock prices right?" No. Margin debt and P/E expansion/contraction is what drives stock prices. Margin debt and P/E ratios at these lofty levels says we are headed much lower. Indeed, a total retrace is likely. That is what history says. We are in a high risk blow bull phase similar to 1929, 1972, 1987, 1998, 1999, 2007. All of those "what happened next" periods say a crash, recession, and financial crises. Average returns are dependent on current valuation levels. So when P/E are lower than average, then future average returns are higher. When P/E ratios are high - as they currently are - then future returns are very low, or average loss, which is the current projection over the next decade. However, during such returns are not linear, with a big sell-off and recovery that average out to zero return is the most likely path forward. Average returns also are influenced by generational moves, where during generational bulls - like we've been in for the latter 1/2 of last century - average returns look high. Then we enter a generational bear phase (for the global economy) - like we are in, that central banks have been propping up with trillions and trillions. Average returns then going forward are the opposite than what was expected. The only average we can count on is bulls follows bear, just as bears follows bulls, where go further than in expected. Bear about to start soon.
kevin,
not going to doubt you as you know what you're doing (long q's :)) but according to zacks, ivestopedia and a few others, stocks are driven by earnings, along with company events, dividends buybacks/splits. i haven't seen margin debt listed but not saying it's not there but isn't one of the main drivers of stock prices. plus simple supply and demand, there has been way more demand to own stocks over the last 9 years than people willing to sell. the fed also has some influence based on their monetary policy stance which over the last 9 years has been pretty remarkable in helping create an unprecedented amount of wealth for our country. their blueprint for success has been
good to see 22k on the dow but don't expect it to hold since it's august (usually worst month of the year for stocks) . don't be surprised to see that 5% pullback come this month. then it's off to the races into year end
the fed also has some influence based on their monetary policy stance which over the last 9 years has been pretty remarkable in helping create an unprecedented amount of wealth for our country.
meant to add:
and created an economic environment which helped companies grow and prosper.
The Central Banks seem to have the power to socialize the capital markets. Print electronic money, buy ETFs and stocks. Crush the VIX. Not even conspiracy anymore. The SNB and BOJ are already doing this. I wonder if the SNB is really just a conduit for the u.s. Fed since it isn't politically tenable for our Fed to be buying stocks here.
T.Berry, here is an article on margin debt. When you saw supply and demand, or the FED influencing the markets, what that means is via debt that is used to buy stocks. Note what happens when margin debt peaks. Fundamentals are simply carrots. When greed is on fundamentals like earnings matter, though valuations don't. When fear is on, fundamentals like earnings don't matter, while valuations do, as investors seek single digit P/E ratios, and safety over growth.
https://www.advisorperspectives.com/dshort/updates/2017/08/01/a-look-at-nyse-margin-debt-and-the-market
bryan is there hard proof the fed is buying stocks? the boj has admitted . i highly doubt our fed would need to do something like that. stocks are doing very well on their own. the fed has and continues to be ahead of the curve. that is why other cb's are copying what our fed has done. why? because it works. our economy is proof.
thanks kevin. i believe the fundies still matter and remain quite as for now. what caused 01 bear was the highly speculative internet craze and in 08 it was fraud lending. what is good about today is we have nothing really crazy going on. this recovery has been solid, sound and organic without any smoke & mirrors. the us economy i believe is the greatest in the world. we are about as far from a recession as you could get right now.
T. berry. I never said our Fed was buying stocks.
oh ok sorry bryan. misread your post. that would be illegal for them to do? yellen doesn't need to be playing games, she's doing a remarkable job as it is. can't believe the donald would even remotely consider someone else. its a no brainer to nominate her for another term.
what an impressive day for the dow, not so much hitting 22k (a no brainer) but holding 22k on the first attempt. once it does for 3 days, we're cleared for take-off
hold on to your dow 22k hats, 23k could be here in a blink (just 4.5% to go)
32nd all time record high of the year. have there ever been any stronger bull markets in history?
tuned into cnbc after hours about 5 out of the last 7/8 days, seems just about every company beat this q. so far every co reporting tonight has beat.
Post a Comment