My E-W count looks complete, into a Bradley turn date and New Moon (top). We closed with a touch right on the ending-diagonal top trendline I had drawn:
 |
| SPX 1Y |
If we get our market turn here, then the task for 2014 is to chop down through the 2013 rally tape. In all of the federal debt reflation rally since 2009, we did not get above 1500 SPX until just last year.
A return of the bear market would undo 2013 by June, then set up a healthy bounce into summer.
 |
| 5Y |
I'm using a stretched-out version of the 2008 tape for now, until it either proves useful or useless. It's a beautiful example of an A-B-C crash pattern, and I hope we see something close to it again. The 3 of C wave actually bounces at SPX 666, some pretty neat geometry in this one.
 |
| 10Y |
And here's the full Jaws of Death since 2000, which will be followed by a USD currency crisis and collapse into hyperinflation.
 |
| ALL |
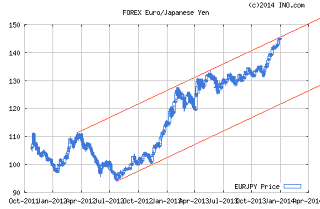
Edit: bonus chart ... EUR-JPY ... hmmm ...
 |
| EUR-JPY |
6 comments:
re: chart'4, jaws of death
Considering we're now clearly over the double top of 2000/2007, what are the rules for the 'jaws of death'?
--
The bears..myself included, were merely pushing out the next collapse wave...with each month from 2010 onward.
We're now 700pts higher, and bears are still at it.
-
Towel throwing time was 200pts lower in my view.
What if we're sp'2100/2300 later this year or in 2015?
What then, just going to keep pushing out the collapse wave?
-
I am currently the only one suggesting it...
but how about we NEVER go below sp'1500..EVER again?
--
regardless, good wishes for 2014.
ps. don't get lost in the hysteria when we see a daily index fall of 1%.
Hey, Bicycle. So you're plotting the TL's from one default to the next. I like that.
I guess my call would be for SPX 560, followed by ... who cares ... get farmland and an orchard!
Will try to finish up another piece this weekend for humble submission to the ZH crew. I make the case for currency collapse! Good clean fun!
Happy New Year! Happy New Moon!
IIRC, Jaws of Death is primarily McHugh's main idea, which he counts on the Dow.
I'll take a look @ the DJIA long-term, see if its monster megaphone is complete, and add the chart here if it is.
i believe we do have that long term top trendline touch on the Dow. i think we do on the Russell 2000 as well.
Wave ii done? 1838 was the halfway-back.
Looking for SPX 1720 by next Thursday, will post charts making the case for this over the weekend.
Looking for SPX 1720 by next Thursday
--
Thur' Jan'9 ?
Ohh come on, seriously?
I mean, hell, that is a crazier prediction than the QE taper via the schedule release.
--
Or is that a typo?
Post a Comment