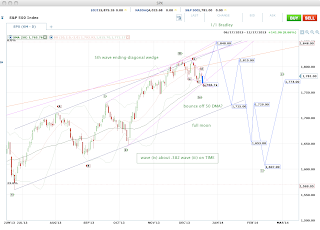
Last night I also noticed that if this is a wave 4 we are in, that it compares to about .382 the length of the wave 3 it is correcting on time. It would be nice if we can drop early tomorrow, maybe enough to touch the 50DMA on the SPX at about 1766.
1766 doesn't quite meet Bryan's requirement for a 3% drop for a significant top here -- 1758 is required for that -- but it would have decent chart support.
 |
| SPX 12-17 |
 |
| 6M |
Hey, neat, Google's Blogger staff fixed the problem I was having rendering images in old blog posts. So the great Casey Serin is at home again in Deflation Land. Thanks, GOOG!
I still have the BMW pictured in that post -- she turns 24 next year.
9 comments:
Well, chart'1 effectively called the floor today...and the upside does look good to the 1830/50 zone into early January.
--
I can't see a collapse wave in 2014.
QE continues at $900bn a year...and that is only $120bn lower than the original rate.
-
Bears got another 4-5 months to wait.
Hey Doomie!
Watch out for that 1/1/2014 Bradley turn ... they were very very good in 2013.
My approach will continue to be cautious bearishness, look for candidate tops, trade them as necessary, but watch the waves down very carefully for clues.
Most of the time the bearish 1-2, 1-2 counts are wrong.
Don't forget, we could dink the UE down another half-percent, declare victory, and taper even more.
"When the Committee decides to begin to remove policy accommodation ..."
..and that is indeed the next issue...
When will they taper down to 60..or a more rounded $50bn a month.
--
Probably sometime between March-May.
-
My best guess is that market will be weaker as a result, but that the intermediate wave'4 lower..will be due to an exogenous 'conflict' event in Asia.
-
Regardless....bears are toast until early 2014.
I just think after a late jan/feb down wave..we head up again.
Of course..that could put in the first lower high.
I think we will get a true bear market, declines as well as vicious rallies. The rallies, if caught, will be almost as profitable as the declines.
With today's statement, now, finally, we may be set up where the monthly EOM POMO schedule may surprise us.
For example, I'm on board with the idea of further tightening in March. But there is no February FOMC. So they either announce it in the January meeting, or they say they will be flexible in the face of all these crazy animal spirits and recovery. Then it gets dropped in our lap EOM February ... a shock increase in the taper amounts, maybe even setting a downward trend.
You know, Doomie, there are only 8 trading days left in 2013. Maybe we put up one of those strings of green, where, no matter the early tape, we somehow manage to pull it out and close green. It has happened before.
The first five trading days of the year are critical. On average, the S&P 500 posts a 10.9% gain for the year when the first five days finish net positive (57 instances), and it finishes roughly flat when the first five days finish net negative (26 instances.
This thing could stall out at 1821 on Monday. My charts are a mess, need some cleaning up. Will see if I can pull something decent-looking together.
re: 'My charts are a mess'
Just stick a broad diagonal arrow...
pointing to the top right, until say...April ;)
--
2014 is going to be a tricky year.
Best guess remains...
Dow 17k...
then 14k...
closing 2014...16-18k
-
How Yellen reacts...will be fascinating to watch.
US government statistics can track the wage-price spiral and a key statistical discrepancy for economic growth. This should indicate a transition from stagflation to hyperinflation. http://alfidicapitalblog.blogspot.com/2013/12/measure-wage-price-spiral-and-economic.html
Post a Comment