Wednesday, August 28, 2013

Charts 08-28: An even larger ending-diagonal and a zig-zag 5th wave

McHugh called Syria a "black swan" right away yesterday, and I don't think he is right ... yet.  Thankfully, the good folks in Russia and China (!) have spoken out on this pending imperial overreach, and there is still time for us to back off and turn this over to the State Department for now.

The tape was very interesting early this week.  I had drawn this little trendline up to SPX 1740, and we were tracking it like a magnet, drawn to it, oscillating around it.  This chart shows how we fell away from it once the Syria story broke.

So are we providing an Air Force for al-queda or AIPAC?  There is still time to stop reading the programming from the TelePrompTer and reconsider.  Empty suit ...

Should "Syria" get put on hold, a sharp rally will ensue.  It would set up the elusive inverse head-and-shoulders here for a nicely-balanced ZIG-ZAG 5th wave:

SPX 08-28 zig-zag 5th wave

A zig-zag 5th wave?  How can that be?  Maybe if it's part of a much larger ending-diagonal, since SPX 1266, like this:

SPX 08-28 2Y - ending diagonal count

The SPX 1768 area, by Friday, September 20, before the German elections, completes the rally and we fall apart.  The serious stuff begins in May of 2015.

SPX 08-28 5Y

Thursday, August 22, 2013

E-D update and a Special Guest Chart from Lunatic_Fringe

First, it looks like the Karl Denninger is in Jim Jones mode again.  Getting just a little cult-ish over there at the TickerForum.

We know how this ends.  Bottoms-up!

TickerForum keg stand

The good news is, I exchanged some email with my old pal Lunatic_Fringe today, and he not only sent me his current chart and count, but he gave me permission to post it up here.  So here it is.  Enjoy!

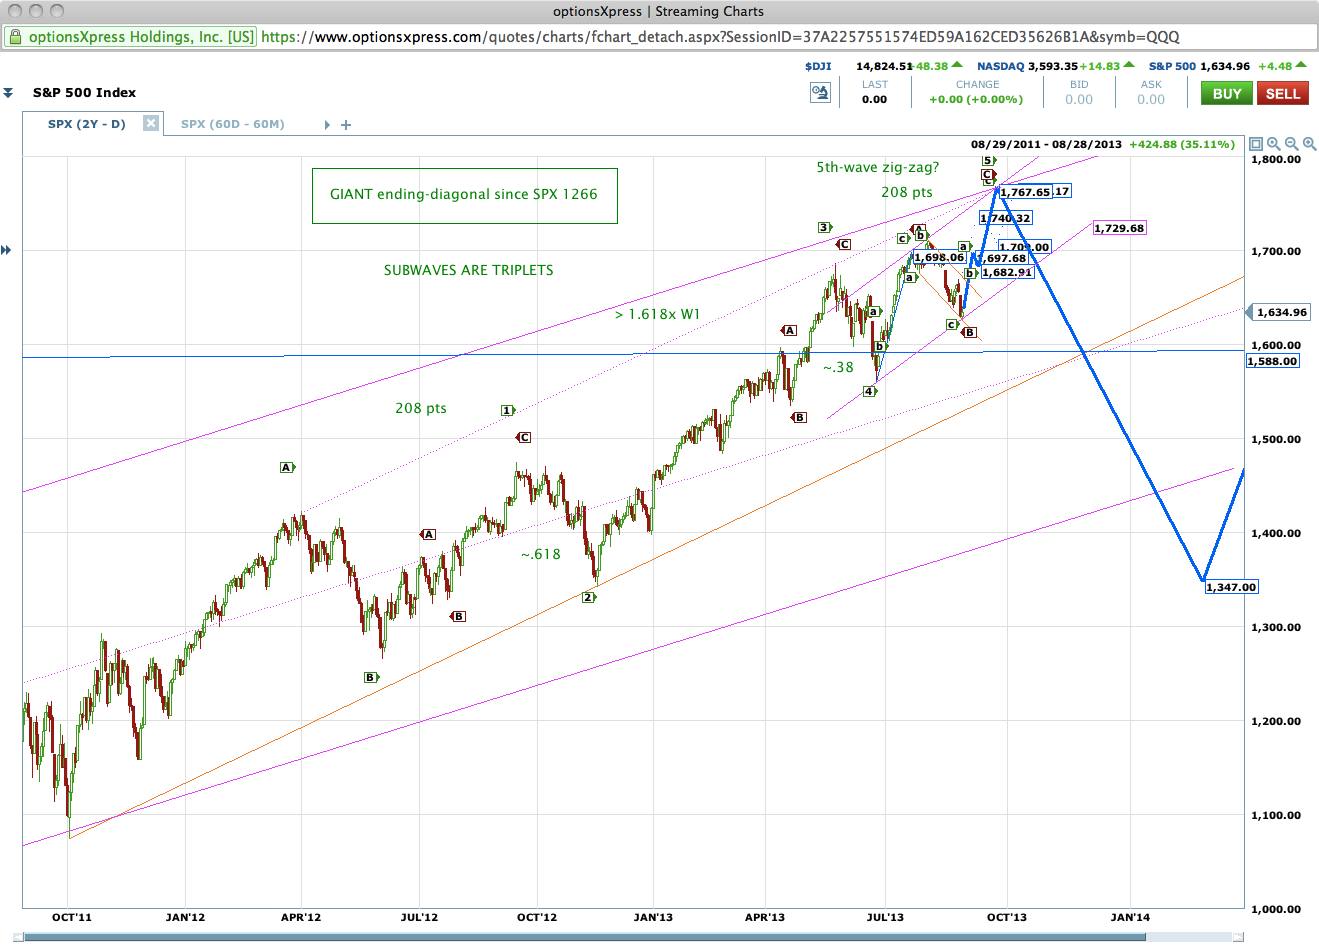
Lunatic_Fringe 8-22 SPX daily

Luna taught me a very simple and important rule, which he learned from a study of Glenn Neely -- that an impulse wave needs to have an unbroken trendline between waves 2 and 4.  If the wave 3 obstructs a trendline between these corners, then your count is off.

Sounds easy enough, right?  And yet, mainstream Elliottician Daneric violates it with his count tonight.  In fact, if you go back and look at all of his broken and busted counts over the years, his 1-2 1-2 and "leading diagonal" down calls, you will find many instances where his counts break this rule.  Which is why they failed.

I'm told it's not Elliott, it's Neely.  OK, fine.  But I believe it's correct.  And extremely useful.

Lunatic_Fringe is a specialist at fib extensions and identifying wave targets, so I was encouraged when he mentioned SPX 1736 as an area of interest to him.  For the "wave 3" of my ending-diagonal, I had suggested 1740.  So let's go!

I left all of my trendlines and channel crap I drew on 8/19 on the chart, unchanged.  Why?  Because the tape seems to have felt out my trendline to 1740 and is using is as support, so far, at any rate.

SPX 08-22

Bigger picture, now with moons!  You could subscribe to an expensive financial newsletter to find out when all of the lunar cycles are ... but I will share them with you for free!

SPX 08-22 ending-diagonal - with moons!

IIRC, the 2007 top was an ending-diagonal as well, but on a shorter timeline.  Let's have a look at her.

SPX 2007 market top

Looks like a bearish ending-diagonal wedge, followed by that elusive leading-diagonal Daneric has called for the last 10 bounces on the chart, until we made new highs.  OK, I'll leave him alone.

Now let's stretch the 2007 top and overlay it onto the current and projected tape:

2007 top morphed onto 2013 tape with October top

I guess I could have stretched this several ways -- like lining up waves 0 and 2, and letting the rest fall into place.  That would put the top well beyond October 8, so we'll keep an eye out for that.

I'll play with this some more, and see if it's at all useful.  If anything, it suggests that wave (iv) in the series might be very shallow, and not make it down to the lower trendline of the E-D.

Thanks again for the chart, Luna.

Monday, August 19, 2013

Charts 08-19: Heading back up

Looking for tomorrow to finish up wave (ii) of a larger ending-diagonal that will give us a final top in early October.  The last Bradley turn caught the bottom at SPX 1560, so I'll propose the upcoming 10/8 turn here.  It works in terms of time and price -- touching 1768 and the top of the 2009 rally channel.

On this timeline, the German election actually gives us the last push to the final top, not the top itself.

McClellan is oversold tonight -- very much so.

SPX 08-19 ending diagonal
SPX 08-19 5Y with 3PDH special effects

I saw my good friend Matt_bear this weekend, and encouraged him to move to WA before the dollar collapses, our Governor declares independence, annexes the nuke subs and carrier fleet in the Sound, and seals the borders.  He still has some time before this scenario plays out.

What concerns me about Matt_bear is how much he resembles the male lead in Taylor Swift's video "Trouble".  I'm pretty sure he is in this video.  I post the entire thing (instead of the goat version) because it is just so horribly BAD (in a Paul Fussell sense).


Thursday, August 15, 2013

Charts 08-15: No top yet

We have yet to touch the top trendline of the big enchilada 2009 rally channel.

CSCO and WMT have the market pulling back, OK.  Time to revert to a previous idea, that we will top with a final ending-diagonal triangle at SPX 1768, touching the top of the rally channel, into 9/20 and the German election.

Perhaps the wags at ZeroHedge are right after all.

Will look for a BTFD opportunity on Tuesday -- SPX 1650?

SPX 08-15 and an ending-diagonal into the German election

Tuesday, August 13, 2013

Charts 08-13: Setup for a blow-off dead whale top

How about SPX 1743 this week?  Then this market can tag the top of the 2009 rally channel and wash up like the dead gray whale my girls found on the beach last week.  

This was just south of Cape Alava, in Olympic National Park.  We saw a cougar cub on the road on the drive out there, 2nd one I have seen this way. 

Dead gray whale, Cape Alava, WA

Subwave 1 of the current series covered 60 SPX handles in 4 days.  The same move here would thrust us north to 1743 into opex, hitting a trendline joining waves 1, 3, and 5.  I can't wait to see the market news commentary on a blow-off move like this.

SPX 08-13

The girls are seasoned hikers now, purposeful and driven.

Ozette Loop, Olympic NP
There is a convergence of several important trendlines here as well.

SPX 08-13 2Y

We missed the flowers in Grand Park this year, but the huckleberries were at peak.

Grand Park, Mt. Rainier NP

The road ahead.  A 1.29x expansion of the 2008 tape hits a LOT of very interesting areas on the chart, and lands us precisely on the megaphone trendline for the 2002-2009 lows.

SPX 08-13 5Y
Good to be back, hopefully in time for the return of the Bear.

Mt. Rainier, over the W. Fork White River